Nathan Kanter - Data Product Manager

Nathan Kanter
Nathan is a Data Product Manager who focuses on making complex healthcare technology clear, usable, and impactful for clinicians, patients, and business leaders. With a background in data visualization and analytics, Nathan utilizes his experience in expierence to healthcare, education, consulting and engineering to work closely with executives, clinicians, and technical teams to design products that balance usability, regulatory needs, and business outcomes.He began his career as a Data Visualization Engineer, where he built interactive dashboards and process-mining solutions that turned large, complex datasets into actionable insights and measurable cost savings. He holds a B.S. from Purdue University along with certifications in AWS, Celonis, and ServiceNow, combining strong technical fluency with a consistent focus on making technology approachable and valuable.
- From: Chicago, Illinois
- Age: 25
Experience
-
May 2025 - Present
Aspen Dental (The Aspen Group) - Chicago, IL
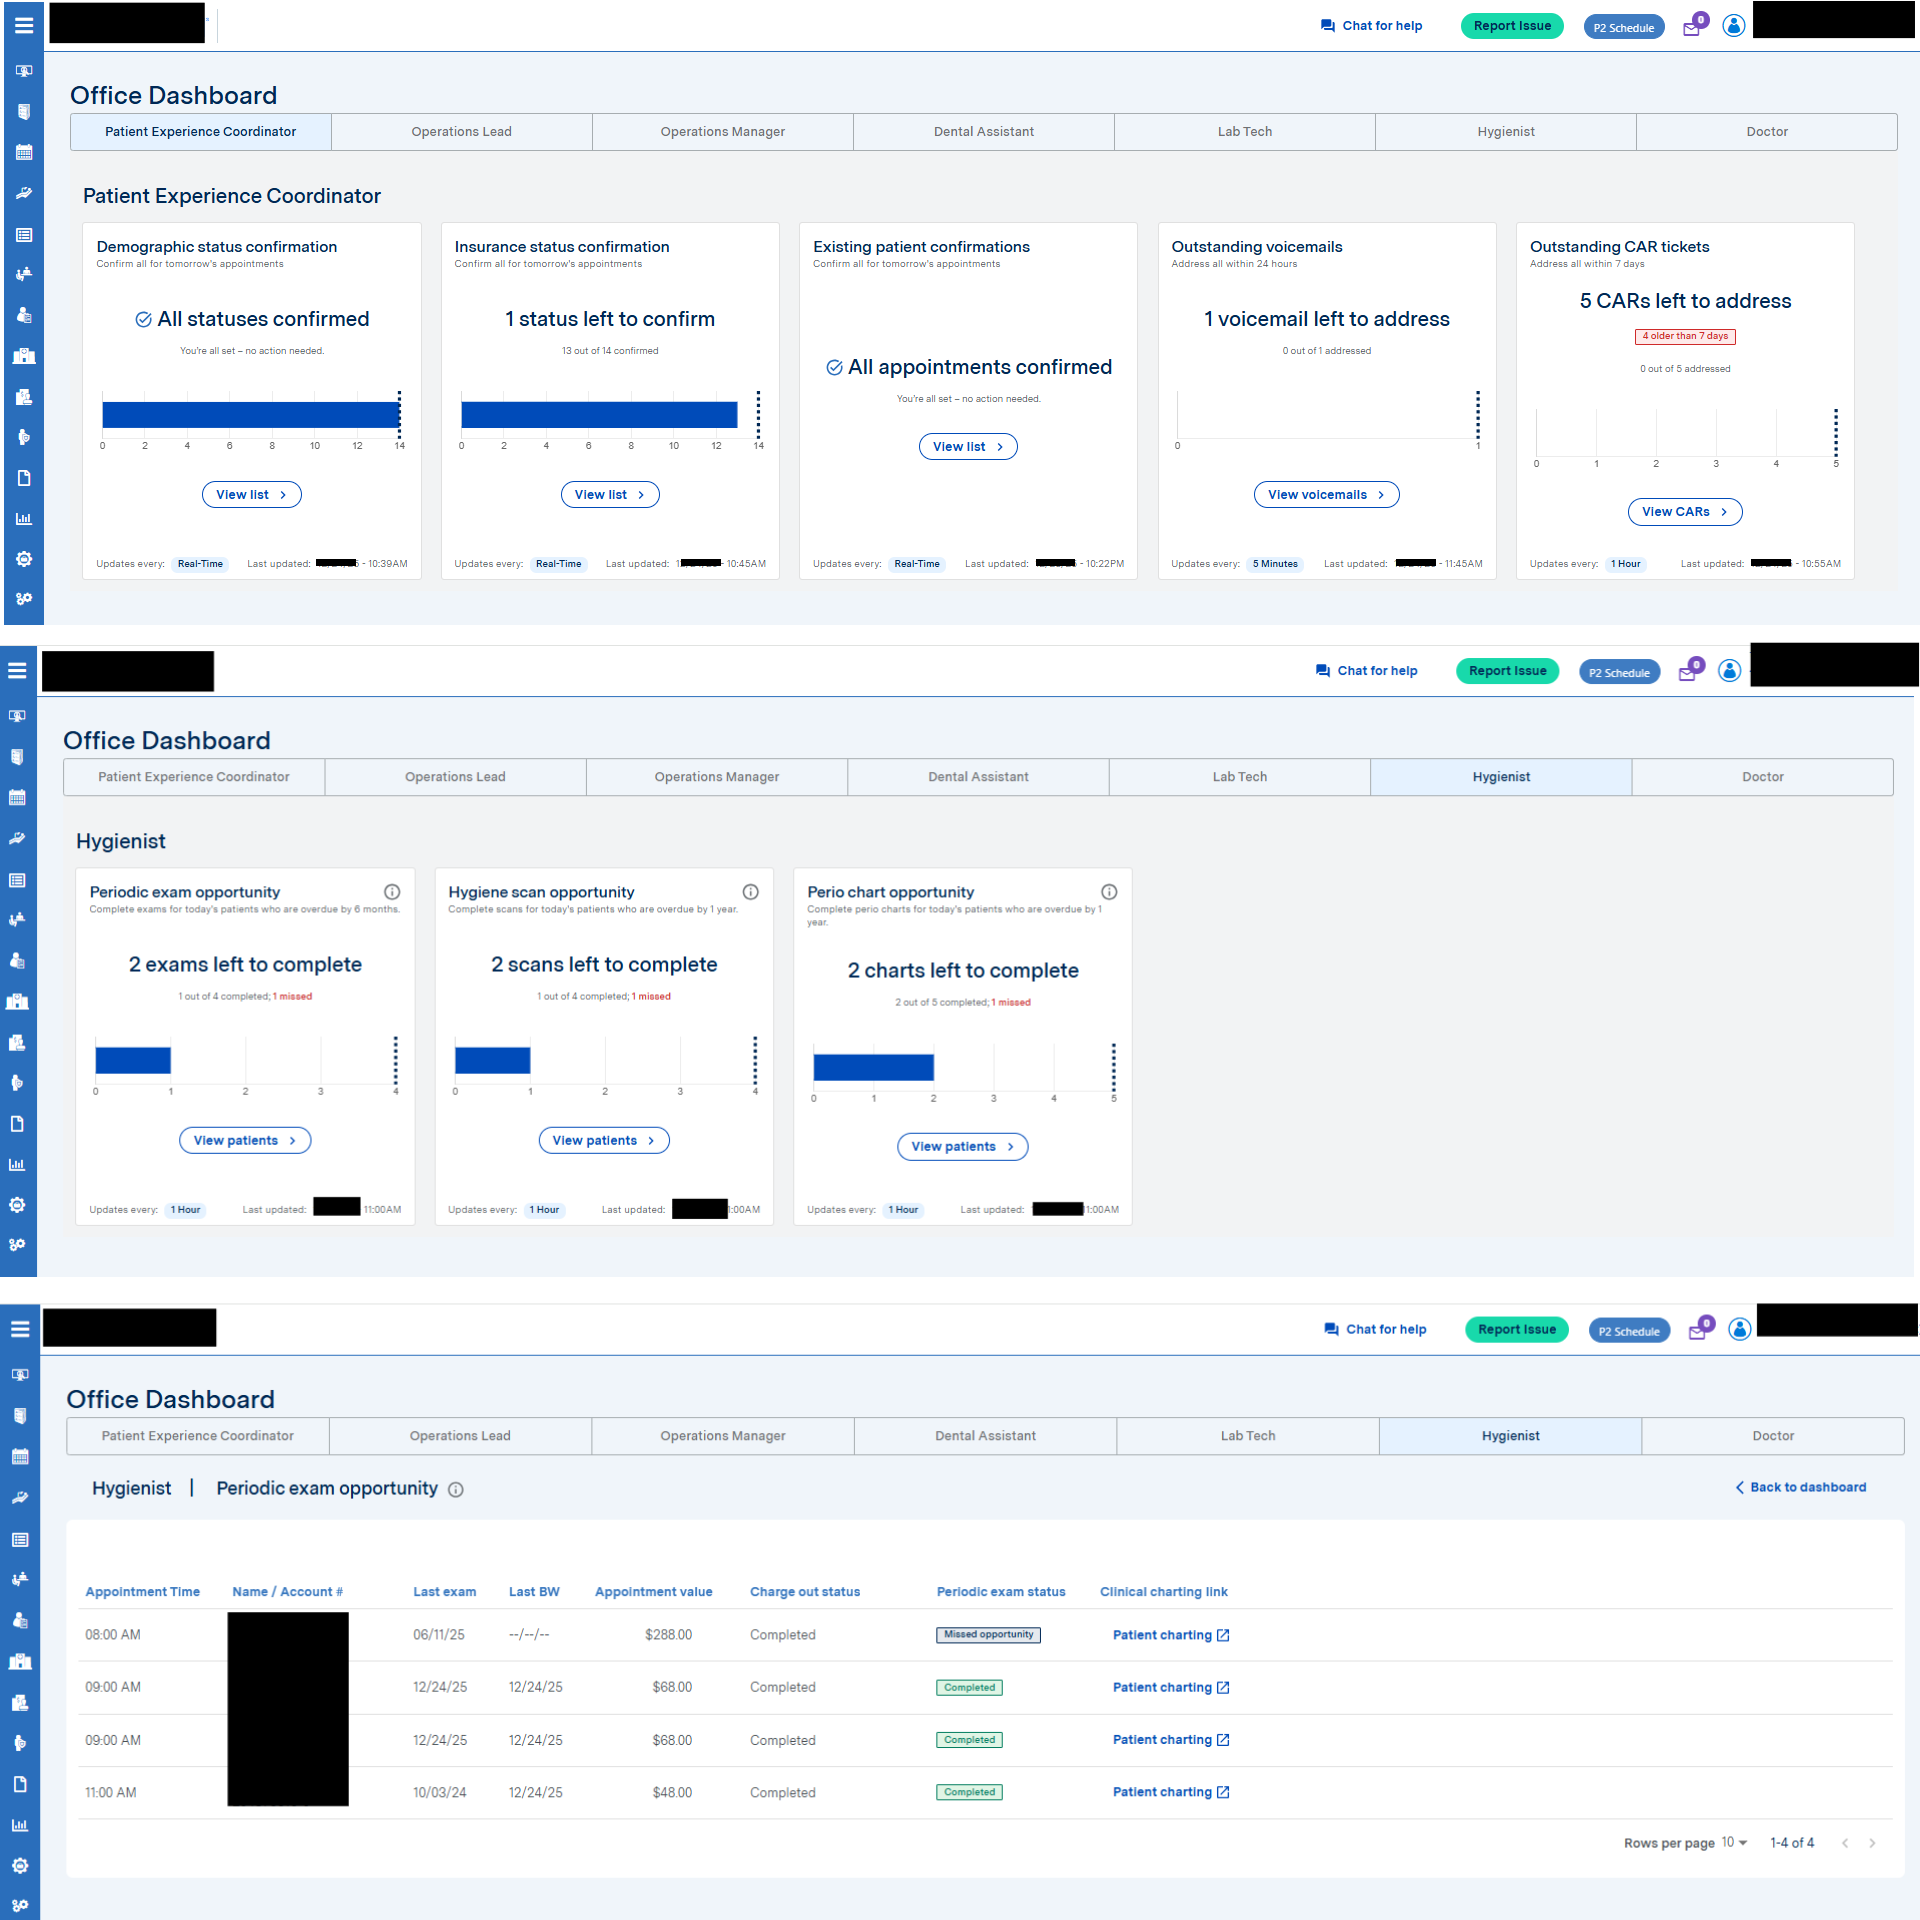
Product Manager - Full Time● Promoted to Product Manager after 5 months for leading the turnaround of a critical internal office software product used across 1,200+ care locations ● Led a cross-functional Scrum team, managing the product backlog and prioritizing features to align delivery with business objectives and clinical requirements ● Oversaw the development of dashboards and operational widgets for both administrative and clinical users, enhancing patient appointment management, patient retention, and regulatory compliance tracking ● Delivered data-driven insights through Tableau dashboards and Google Analytics, providing leadership with performance visibility and product usage metrics ● Partnered with stakeholders including compliance officers and clinical leadership to ensure adherence to healthcare standards and reduce risk exposure ● Implemented real-time compliance monitoring tools that mitigated potential penalties of up to $10,000/day per location
-
Jan 2025 - May 2025
Aspen Dental (The Aspen Group) - Chicago, IL
Business Analyst - Full Time● Created a foundational product roadmap addressing key gaps in compliance, user experience, and reporting ● Conducted in-depth discovery to identify root causes in a struggling software initiative, with a focus on clinical workflow support and data integrity ● Collaborated cross-functionally to ensure that office-facing tools supported clinical compliance workflows and operational efficiency, aligning with healthcare regulatory standards ● Provided feedback on data tracking design, implementation logic, and workflow usability, drawing on prior consulting experience as a data visualization engineer
-
Feb 2024 - Jan 2025
Eastern Industrial Automation - Manchester, NH
Data Analyst - Contract● Designed reusable Power BI dashboards to evaluate website taxonomy and product performance, enabling data-driven product category decisions ● Partnered with senior executives to translate insights into actionable strategies, directly influencing product positioning and revenue growth ● Developed optimized SQL queries to enhance reporting efficiency and data accessibility for cross-functional stakeholders ● Identified under performing categories and recommended strategic adjustments that increased sales by 18%
-
Jul 2022 - Nov 2023
NTT DATA Services - Chicago, IL
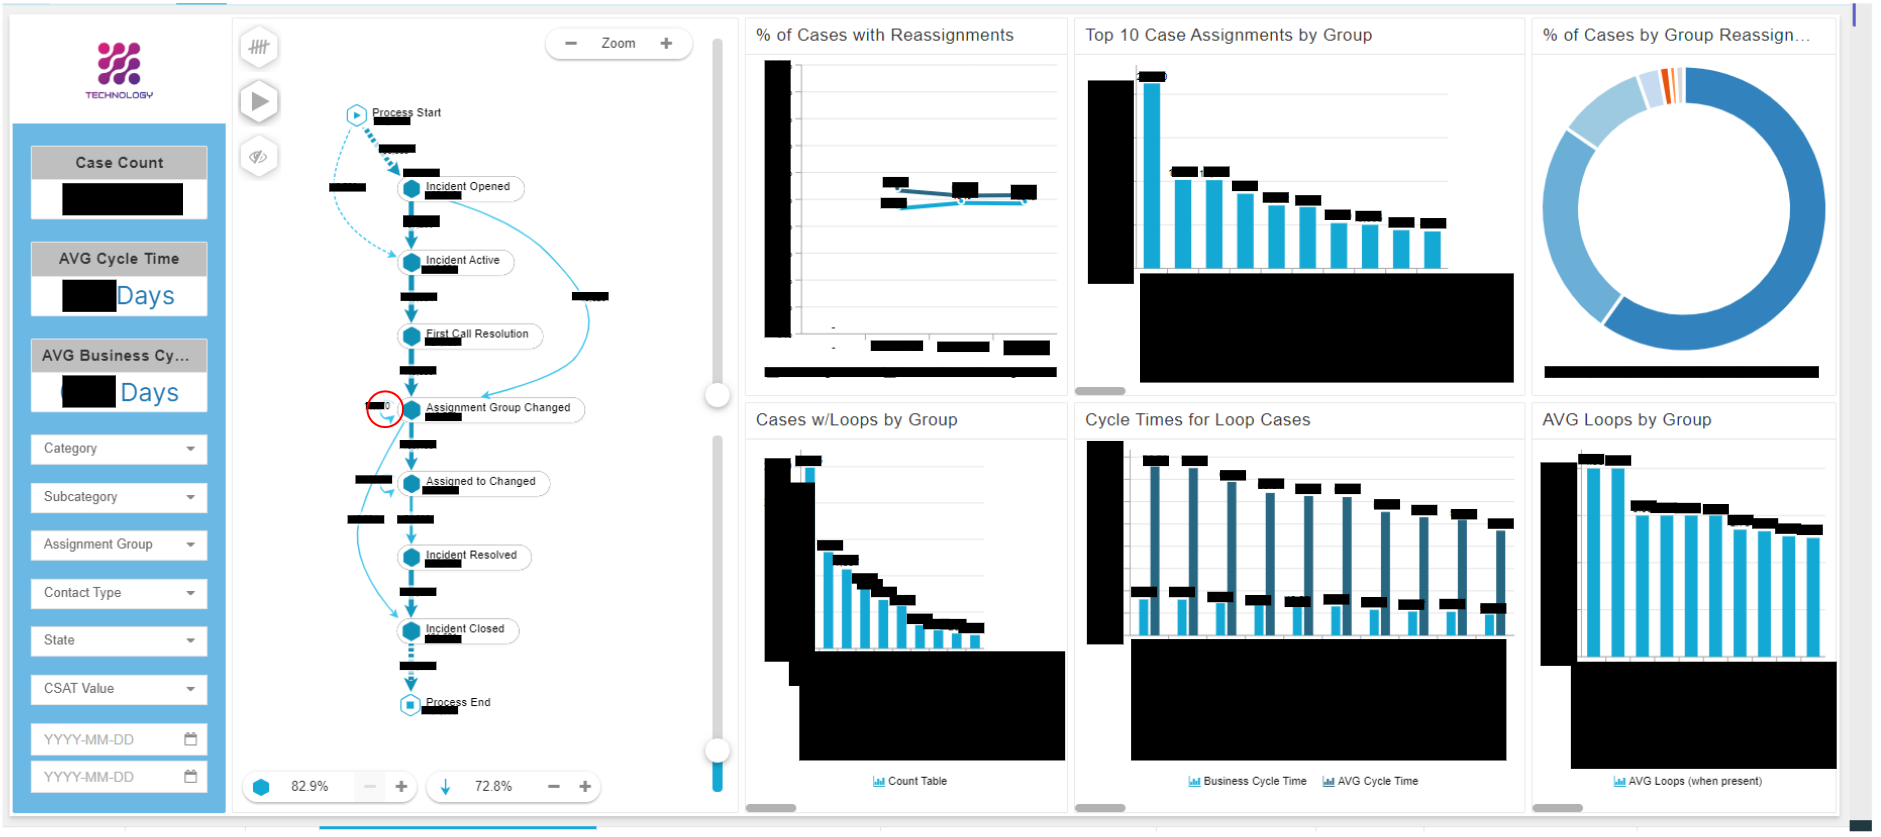
Data Visualization Engineer - Full Time● Negotiated project priorities and deliverables with executive stakeholders (SVPs), aligning analytics outcomes with business goals ● Developed process-mining dashboards on ITSM workflows, uncovering inefficiencies and driving cost savings exceeding $2.5M ● Directed and trained offshore teams, ensuring sustainable support for client data products and visualizations ● Led client-facing data initiatives using Scrum, delivering analytics solutions for a global airline and entertainment company on time and within scope ● Delivered internal training on visualization best practices, elevating team capability and ensuring consistent product quality ● Executed comprehensive data management and configuration tasks, optimizing client data for accurate analysis and reporting by utilizing Celonis, SQL, and PQL ● Optimized client data through Celonis, SQL, and PQL configurations, ensuring accuracy for product reporting and strategic decision-making
-
Nov 2019 - May 2022
Purdue University: CGT department - West Lafyette, IN
Data Research Analyst - Part Time● Served as the Technical Lead for the Lupus project at the Byrd Visualization Lab, overseeing technical aspects and ensuring seamless execution of research initiatives ● Conducted comprehensive research on Adolescent Lupus Symptom Clusters, analyzing data to identify trends and correlations that informed clinical understanding and treatment approaches ● Developed advanced Tableau dashboards and interactive Python visualizations, providing intuitive and impactful data presentations that facilitated data-driven decision-making ● Acquired in-depth knowledge of Lupus, enabling effective communication with hospital personnel and internal stakeholders, to ensure accurate interpretation and application of findings ● Discovered a major clinical insight, significantly advancing the understanding of Lupus in adolescents and contributing to potential improvements in patient outcomes
-
May 2021 - Jul 2021
Roche Diagnostics - Indianapolis, IN
Finance Analyst - Contract● Utilized SQL and Alteryx for efficient database management, ensuring data integrity and streamlined data processing for financial analysis ● Developed a comprehensive Tableau dashboard to be used for the VP of Finance to the lowest level analyst, thus providing clear insights into financial actuals and supporting data-driven decision-making ● Designed and implemented an internal website, enhancing the finance department's operational efficiency by centralizing resources and tools for improved workflow ● Presented complex financial data to the company CFO, simplifying and streamlining insights to provide opportunities for the executive team to make informed strategic decisions
-
Jun 2020 - Aug 2020
Thermo Systems - East Windsor, NJ
Control Systems Developer - Contract● Developed a boiler control system for the University of Massachusetts Amherst using the FactoryTalk Suite ● Helped manage crucial documents such as design and alarm specifications ● Wrote crucial tutorials to be used by incoming control system employees ● Assisted with configuring computer networks and PLC connections
-
Jun 2019 - Aug 2019
UPS - Louisville, KY
Business Analyst - Contract● Created visual representations of financial data for senior management to identify resource allocations for company projects ● Manipulated copious amounts of data to present vital information to senior management in a concise and digestible way ● Was Scrum Master for an agile development team ● Created user stories and communicated the acceptance criteria based on the client's needs
Education
-
Aug 2018 - May 2022
Data Visualization Web Programming & Design
Purdue UniversityAttended Purdue with a dual major in Data Visualization and Web Programming & Design, graduating with distinction. GPA: 3.83
-
Aug 2014 - Jun 2018
Public High School
Bedford High SchoolIn Bedford, New Hampshire, Kanter took a large amount of IB classes and performed over 400 hours of community service. GPA: 4.11 (4.0 Scale)
Awards
-
May 2025
Team TAG: Impact Award
Award given by the Vice President of Product at The Aspen Group in recognition of the employee who had the largest impact on the department.
-
May 2021
1st Place Team in Digital Divide & Inclusion in Education Challenge
In this data challenge, my team and I completed against other data scientists and economists from universities around the world to donate £50,000 to a non-profit educational charity of our choice. This challenge was issued and run by the XPrize Organization and the Open Data Institute.
-
Apr 2021
3rd Place Interdisciplinary Studies Research Poster
Issued by the Purdue University Office of Undergraduate Research at the Purdue Undergraduate Research Symposium for my Lupus research done as a Research Data Anlyst.
-
May 2020
Top Overall Abstract in Mathematical & Computational Sciences
Issued by the Purdue University Office of Undergraduate Research at the Purdue Undergraduate Research Symposium for my Lupus research done as a Research Data Anlyst.
-
May 2020
George McNeely Scholarship
Based on academic merit, this Scholarship is for a full time sophomore or junior
-
May 2018 & May 2019
Technology Alumni Scholarship
For belief in this student’s academic achievement and their ability to use technology
-
Mar 2018
Purdue Presidential Scholarship
For high academic achievement, leadership, and service in one’s school and community
-
Mar 2015
American Legion Citizenship Award
To recognize someone with qualities of courage, honor, leadership, patriotism, scholarship, service, and true Americanism
Skills
Advanced skills
• Data Analysis
• Data Visualization
• Business Intelligence
• Microsoft Power BI
• Tableau
• Agile Methodololgies
• Alteryx
• User Experience Design
• Technical Documentation
Proficient Skills
• Project Management
• Stakeholder Management
• Database Management
• SaaS Systems
• SQL
• Python
• HTML/CSS
• Celonis
• Adobe Creative Suite
Portfolio
Aspen Dental Patient Management System
Product Management, Healthcare
NTT DATA Celonis Engagement
Process Analysis, Dashboards
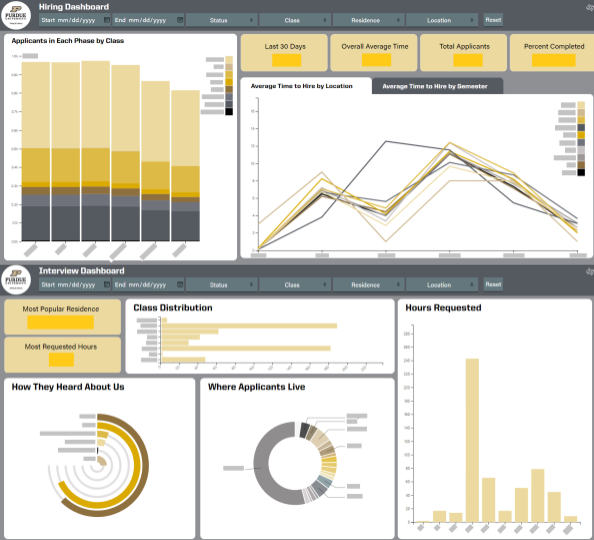
Purdue Dining New Hire and Interview Web-based Dashboards
Databases, Dashboards
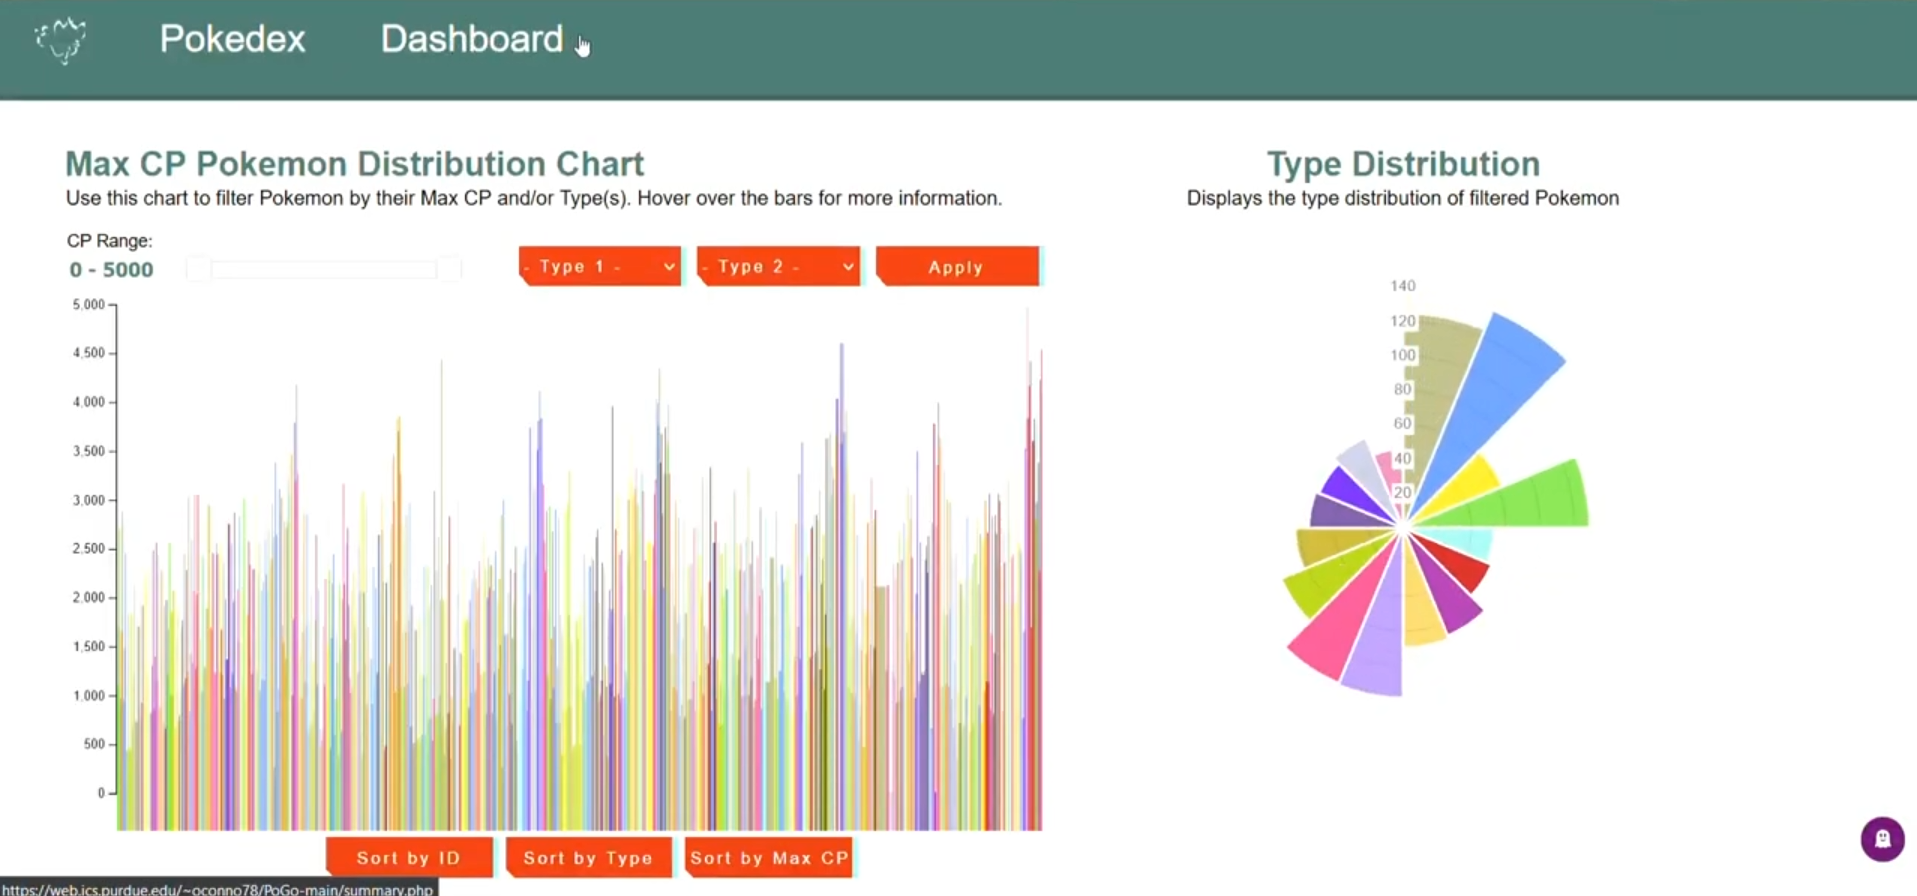
Pokemon Go Website and Dashboard
Databases, Dashboards
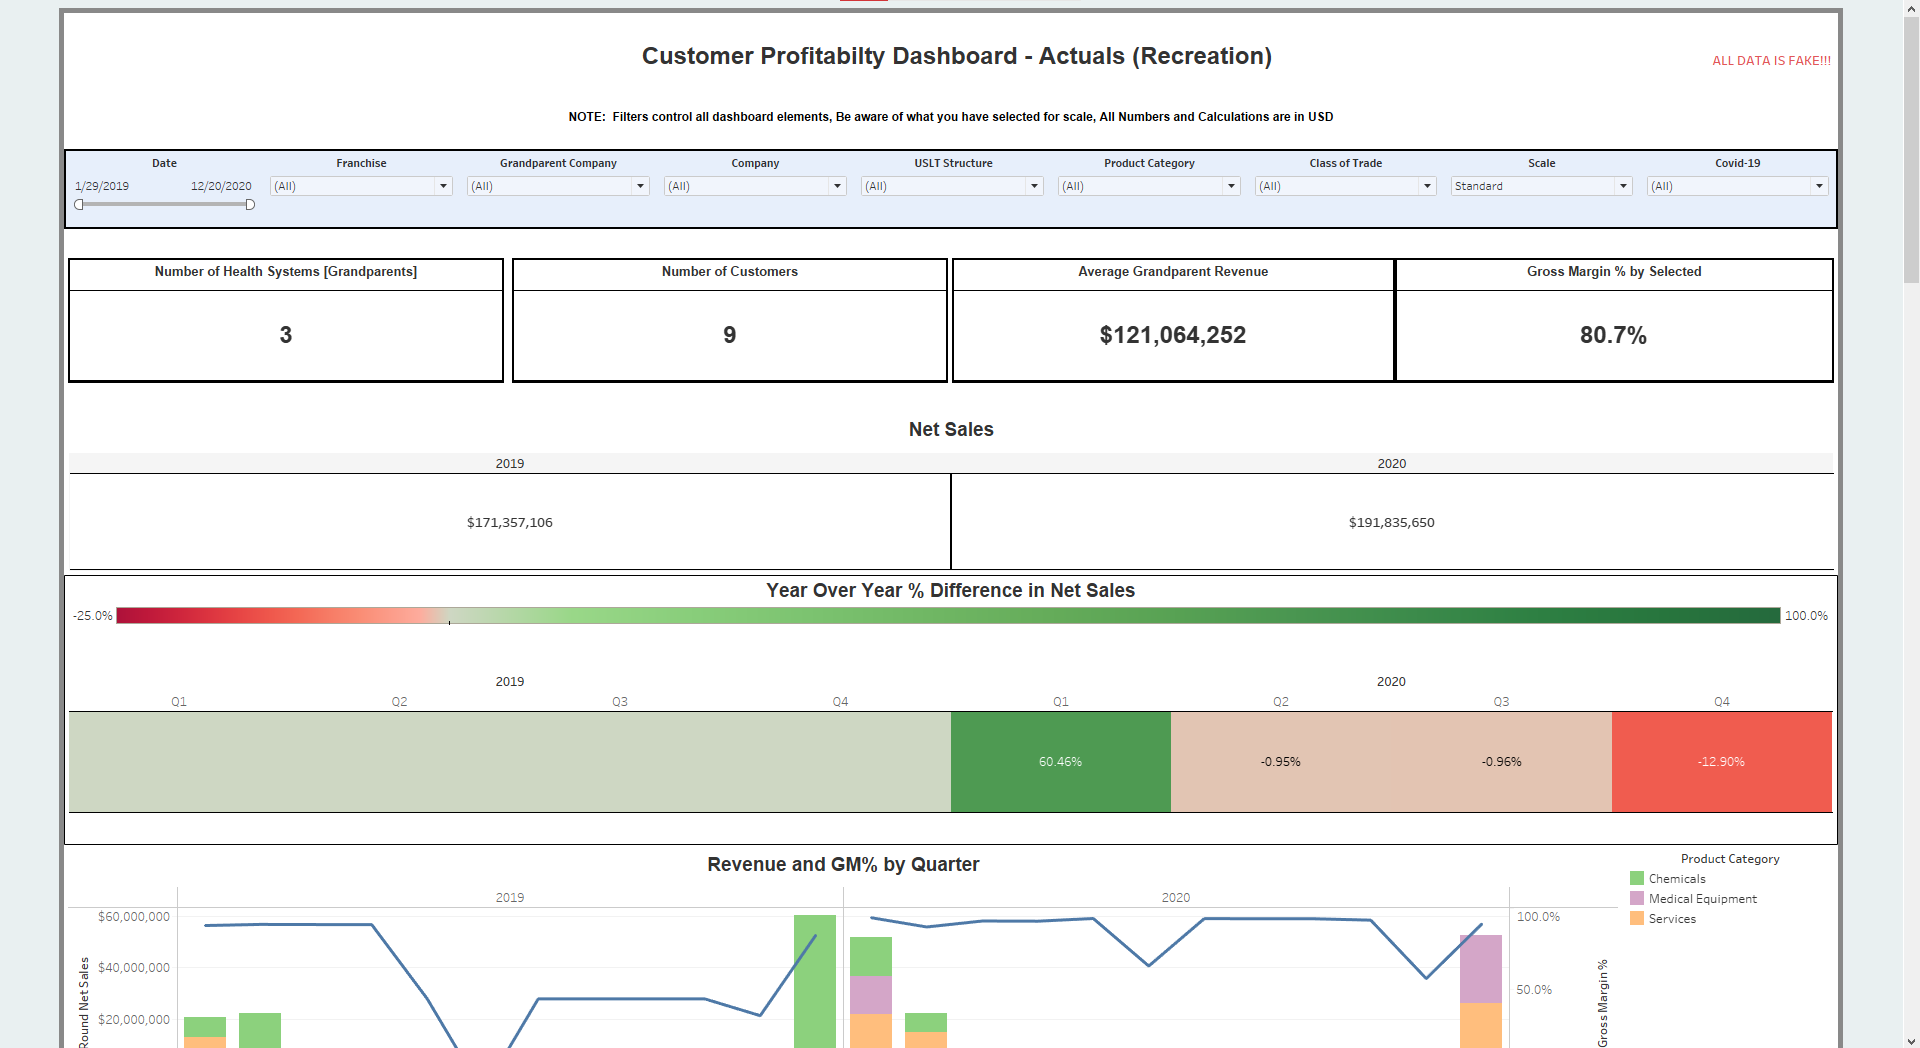
Roche Diagnostics Customer Profitability Dashboard
Finance, Dashboards
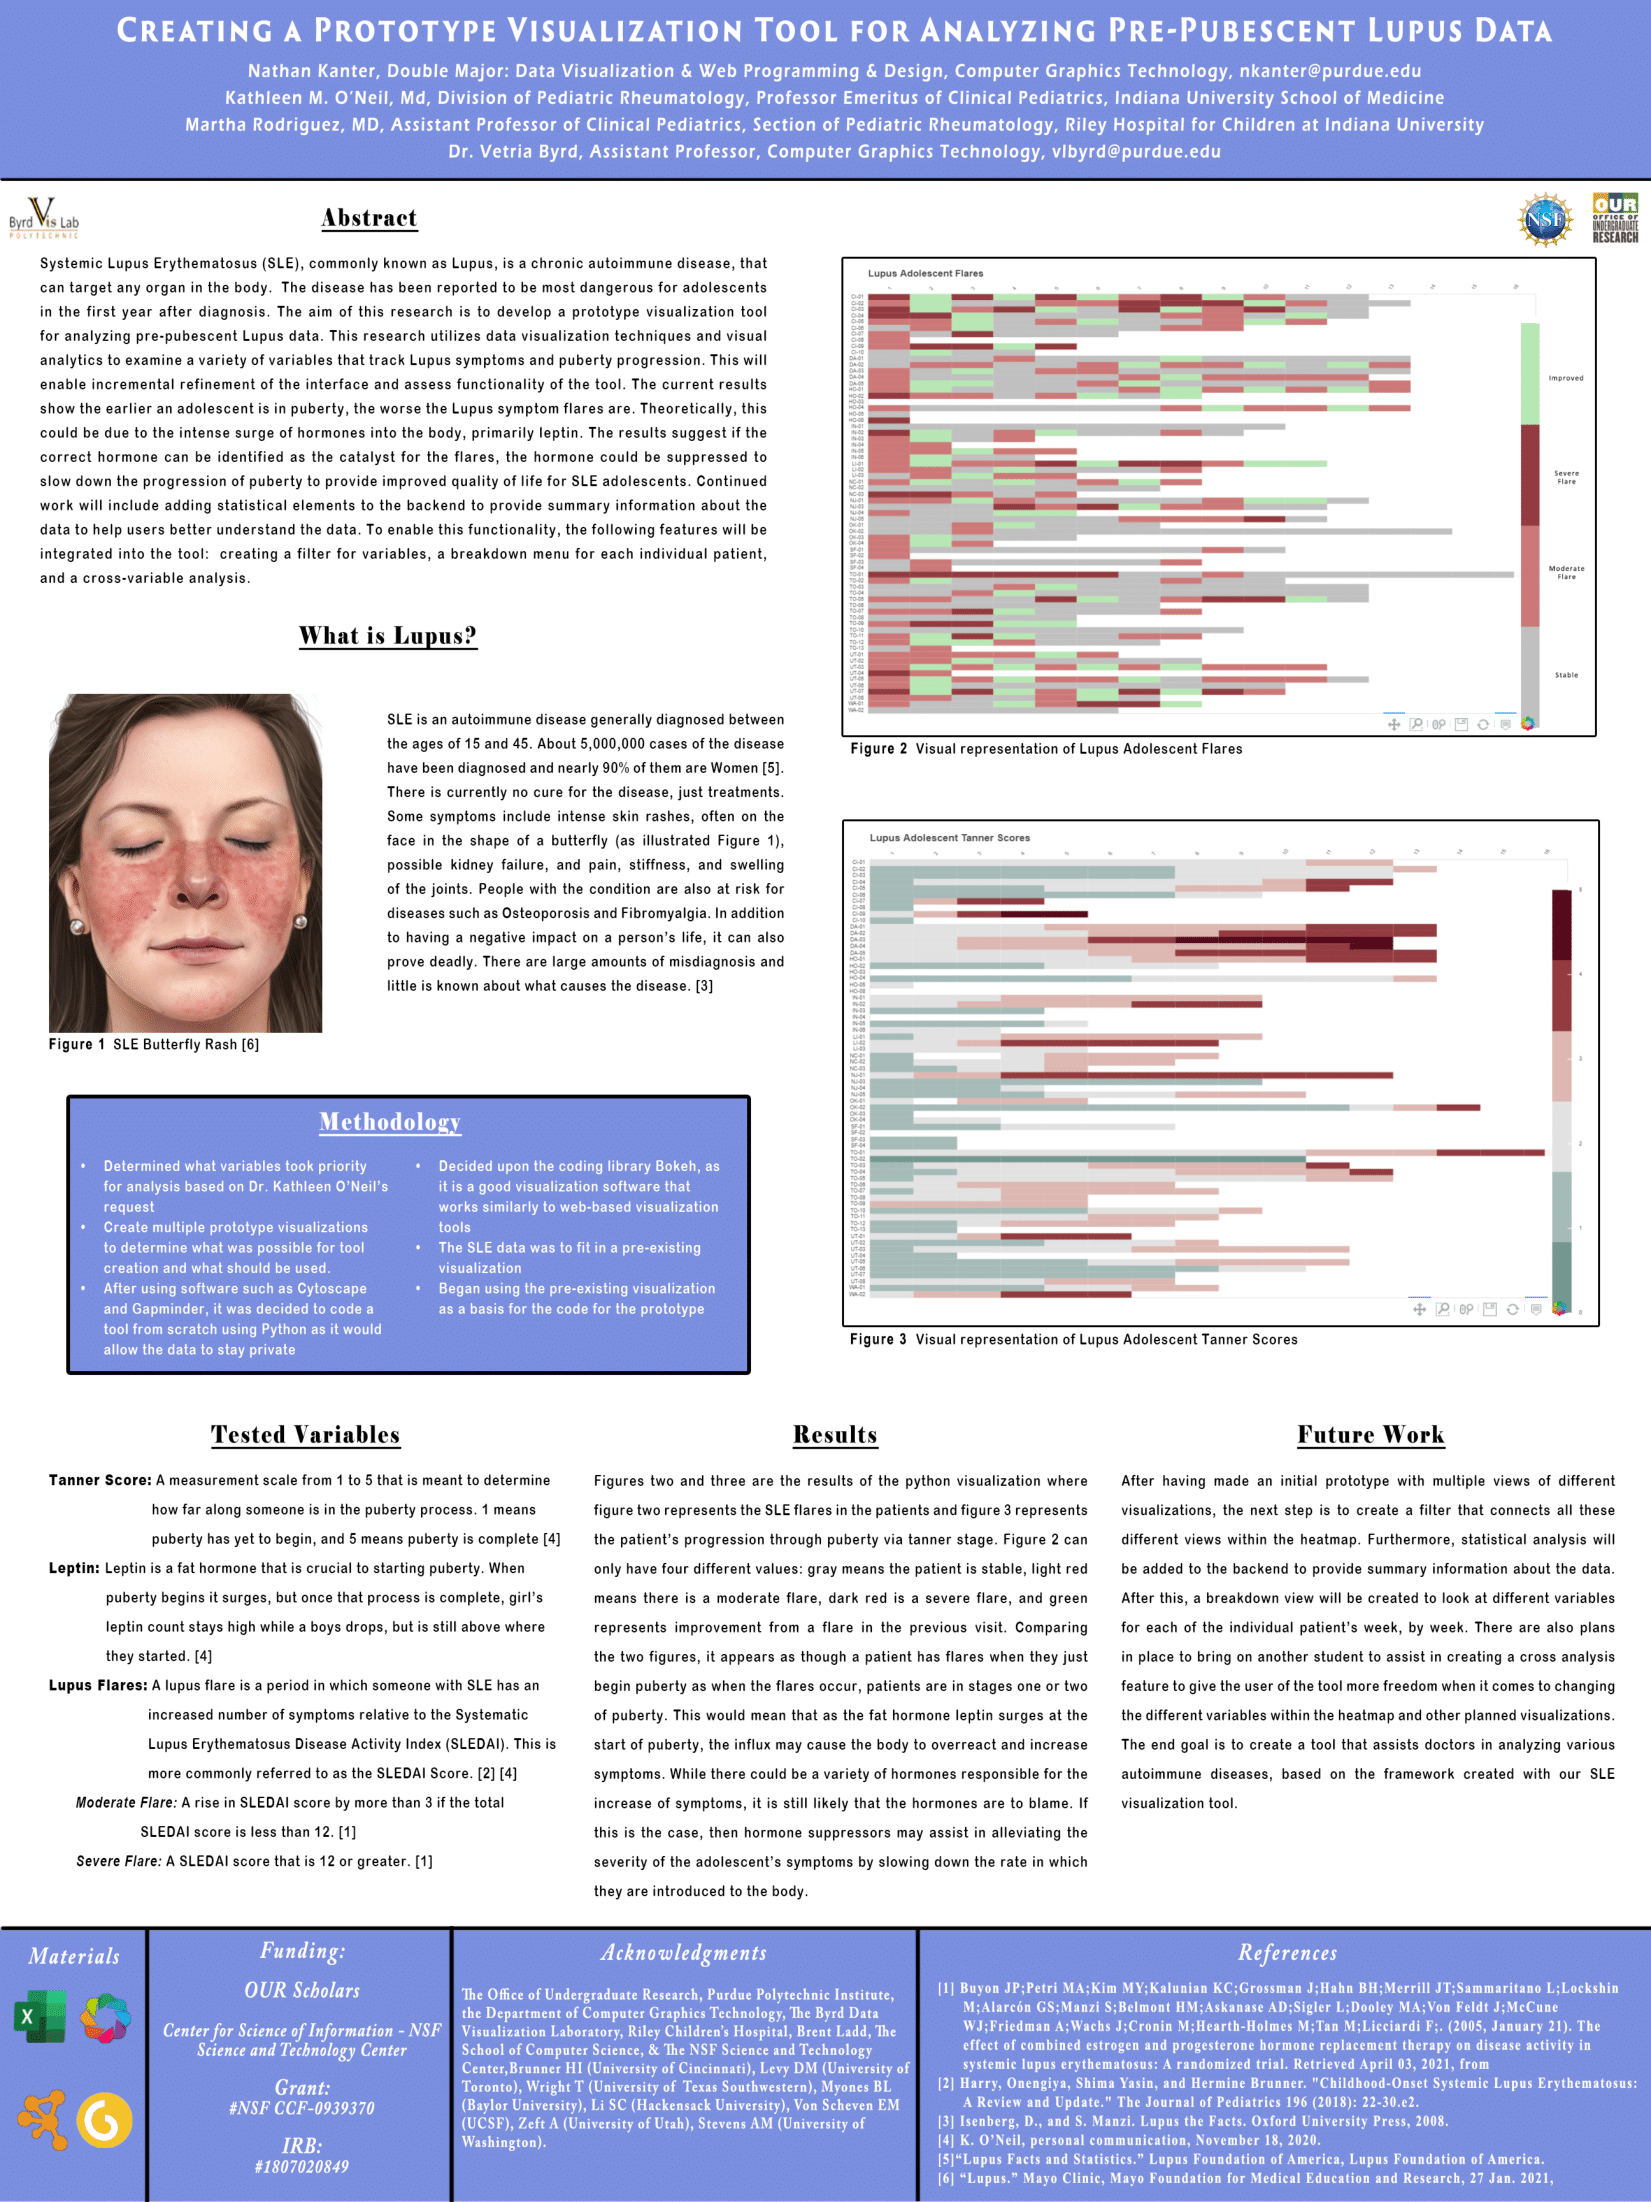
Creating a Prototype Visualization Tool for Anlyzing for Anlyzing Pre-Pubescent Lupus Data
Research, Healthcare

A Method for Transforming a Broad Topic to a Focused Topic for Developing Research Questions
Research, Education
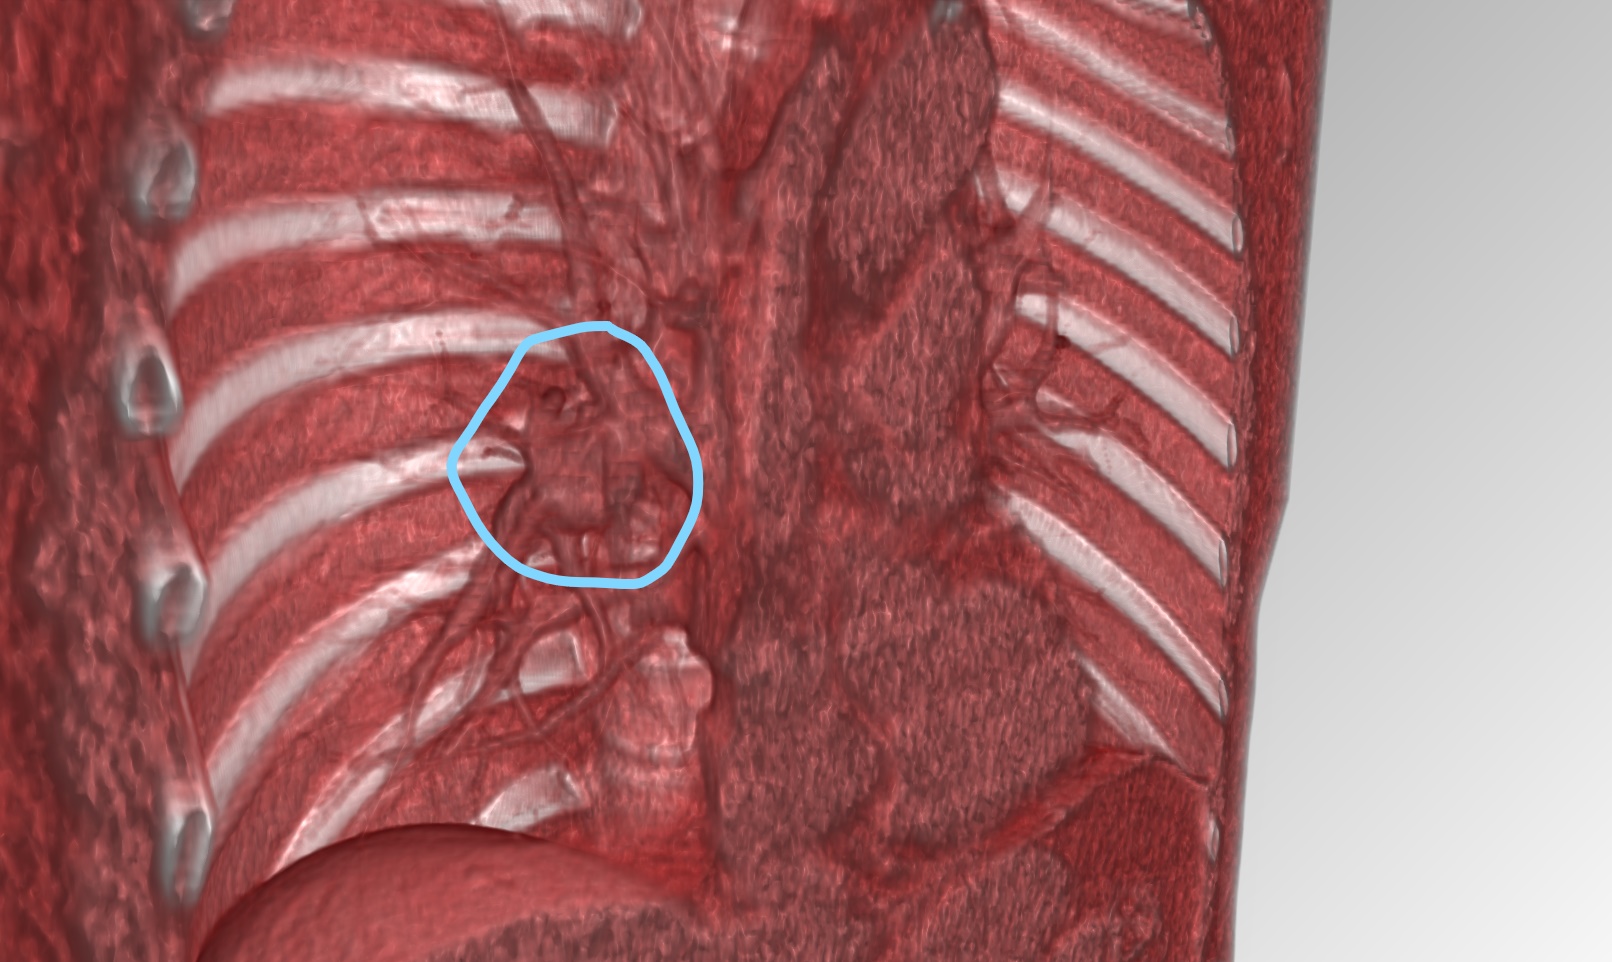
Comparing Lung Tumor Detection with 3D Modeled CT Scans
Modeling, Healthcare
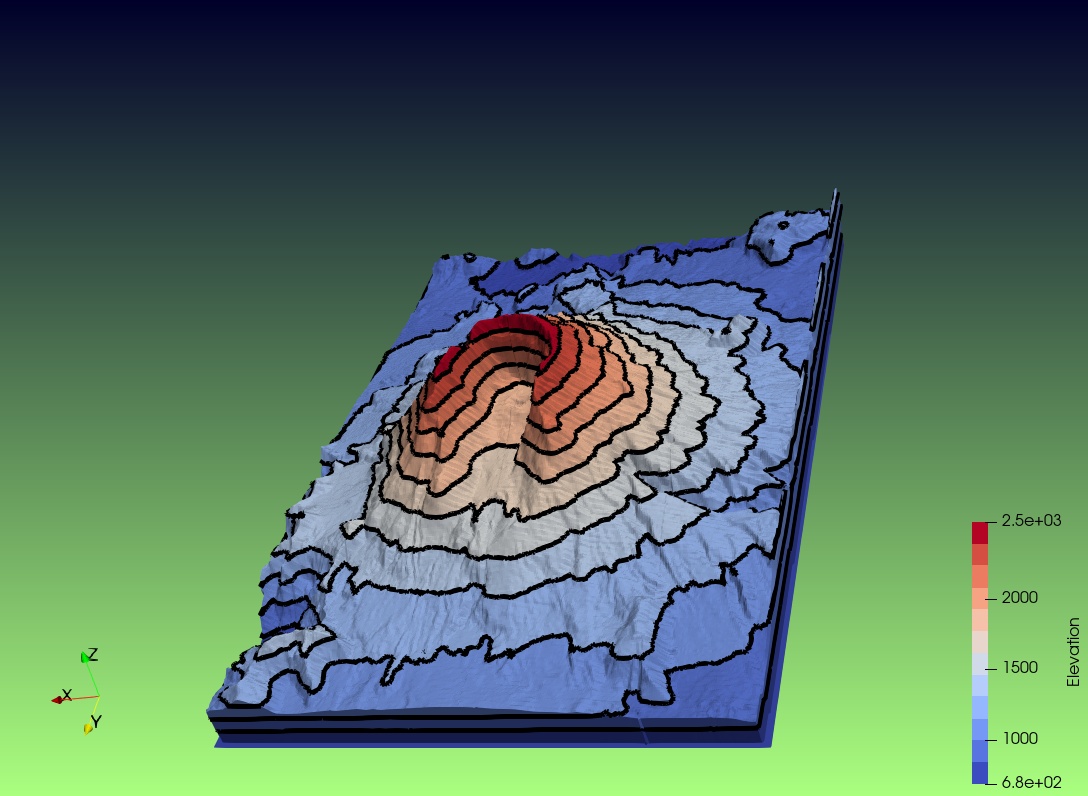
3D Volcano Eruption Height/Contour Map
Volcanos, Modeling
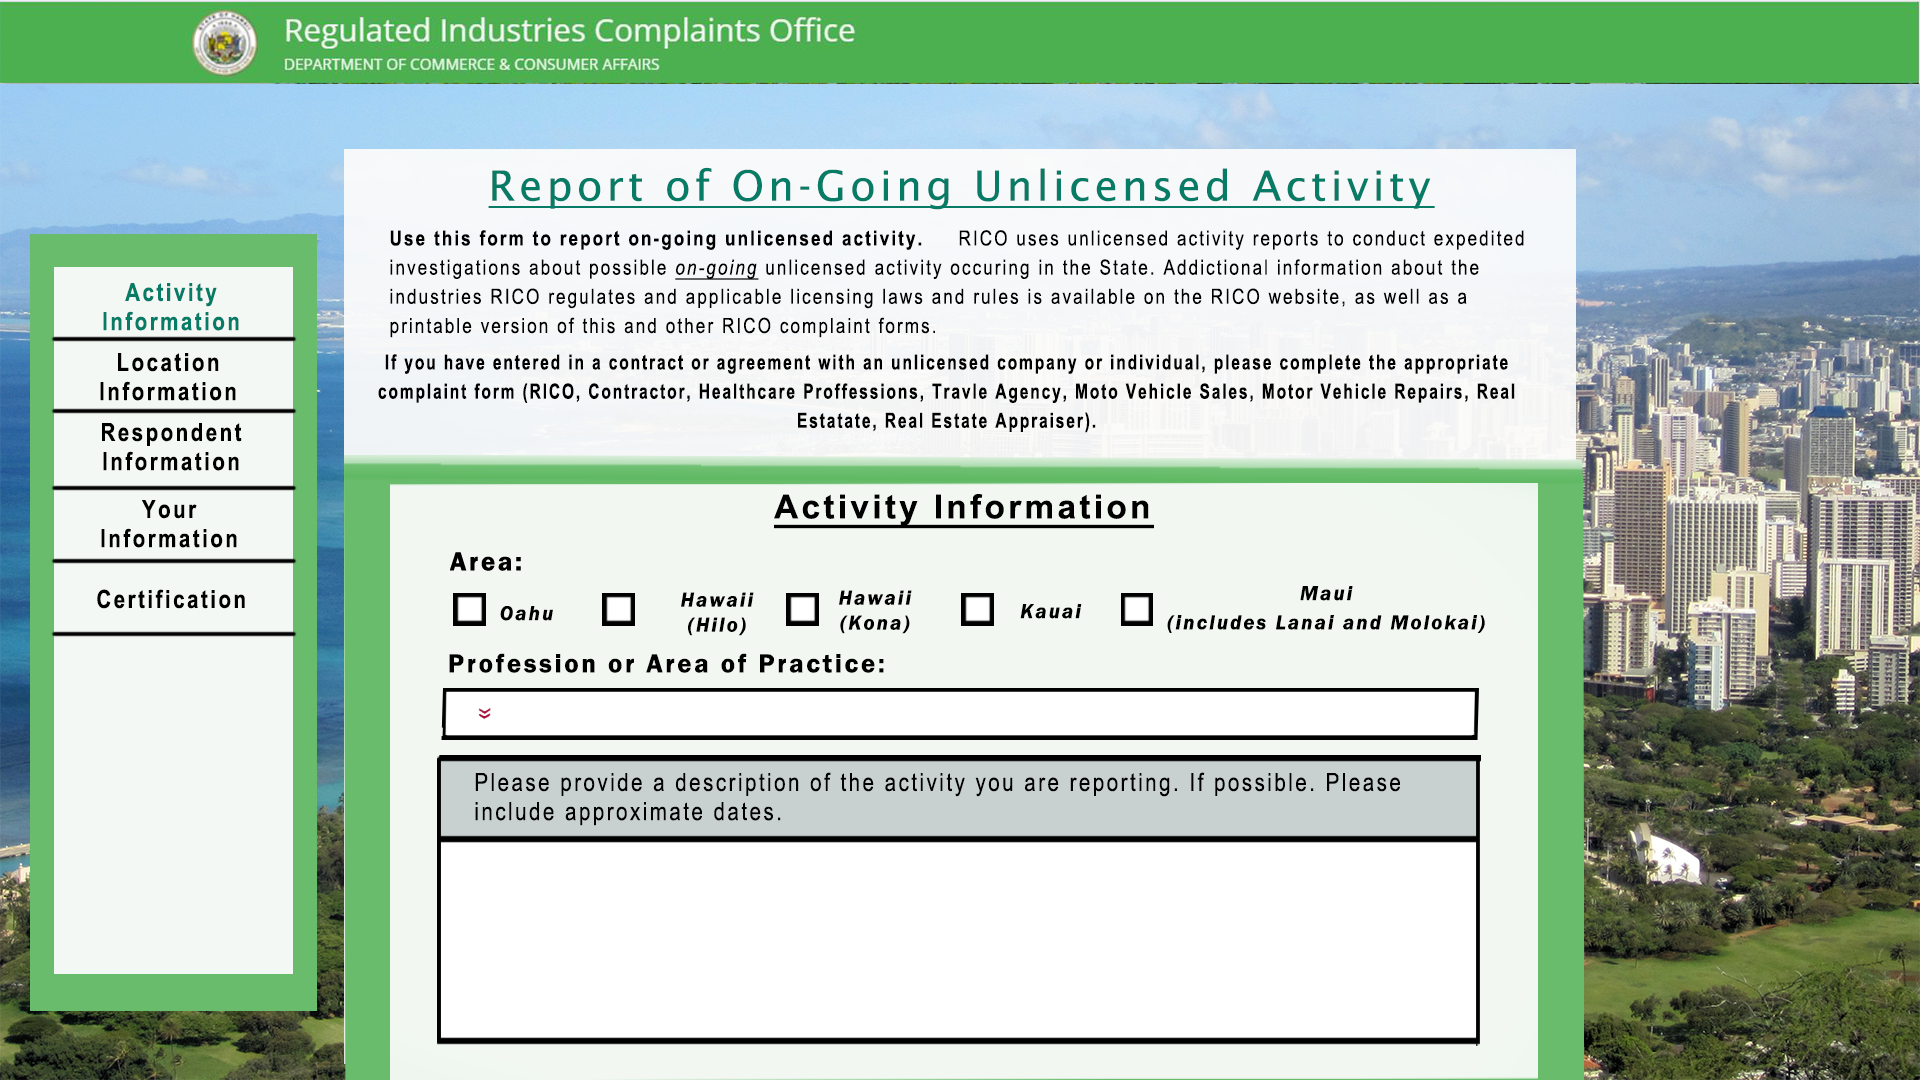
Hawaii State Government(CCA): Website Mockup
UI/UX, Design
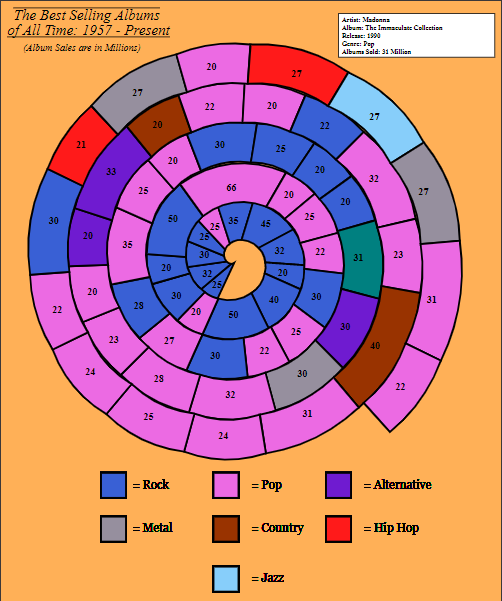
Spiral-Shell Timeline: Best Selling Albums
Original Content, Music
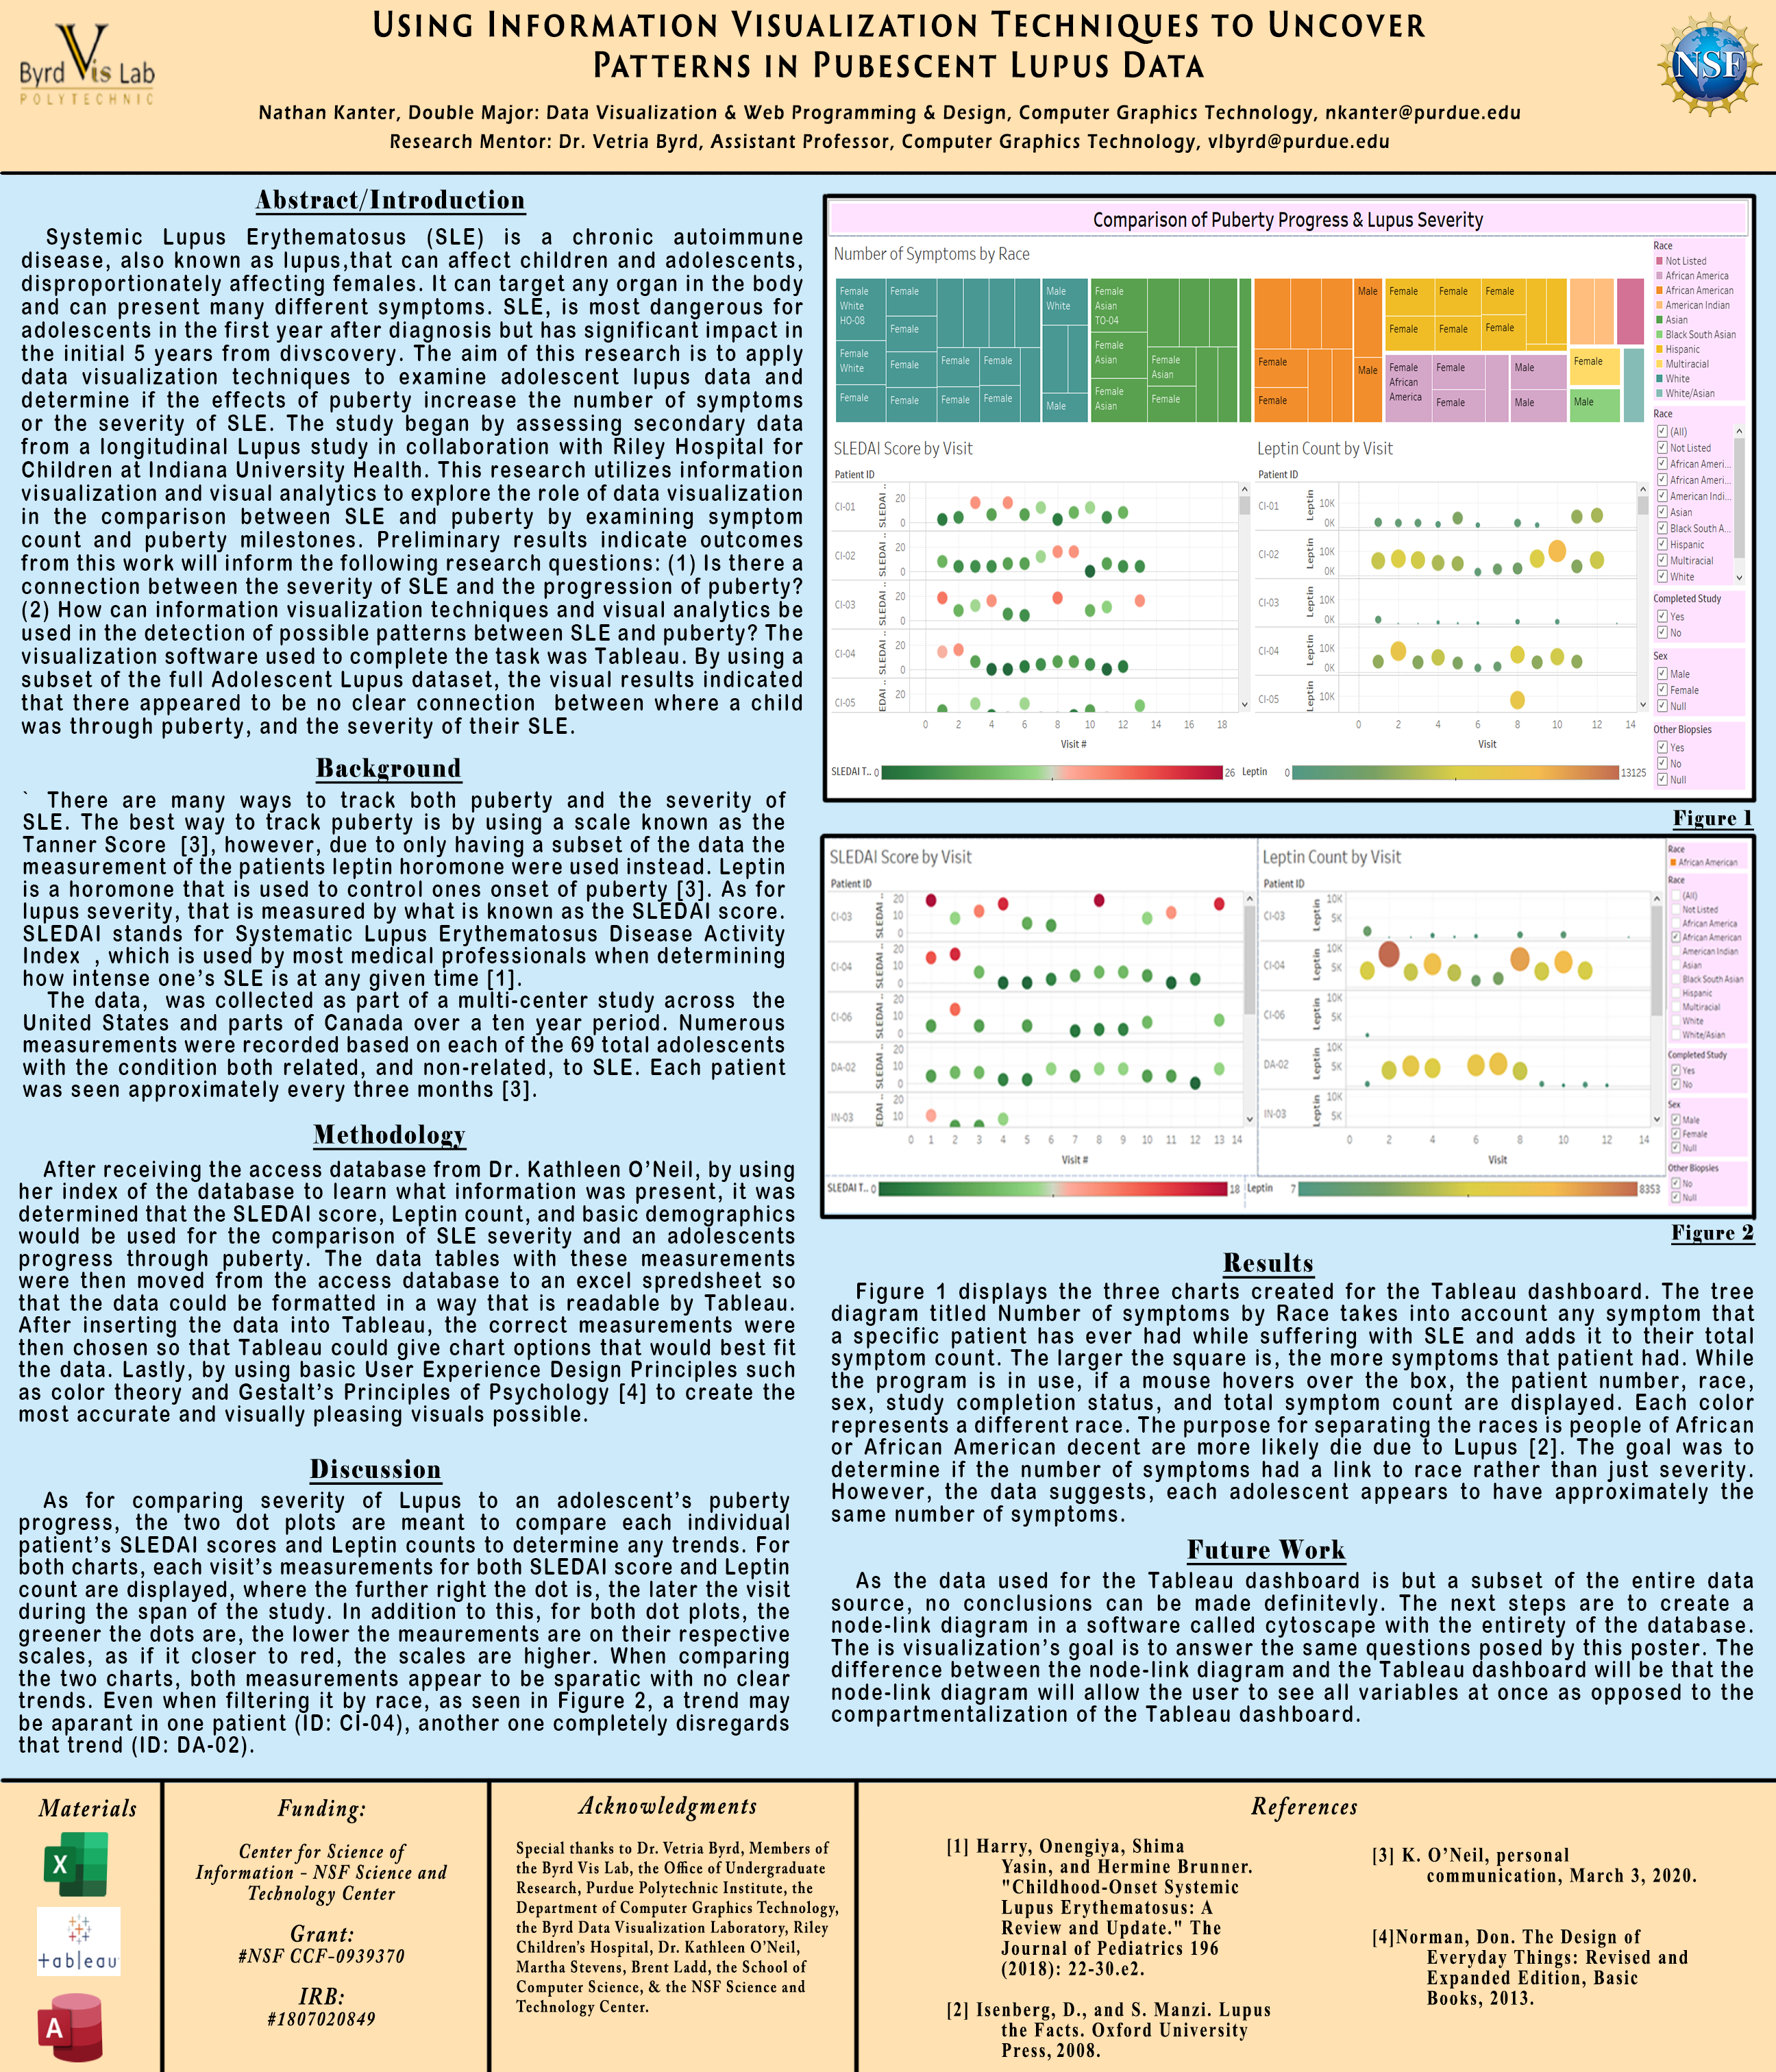
Uncovering Patterns in Pubescent Lupus Data
Research, Healthcare
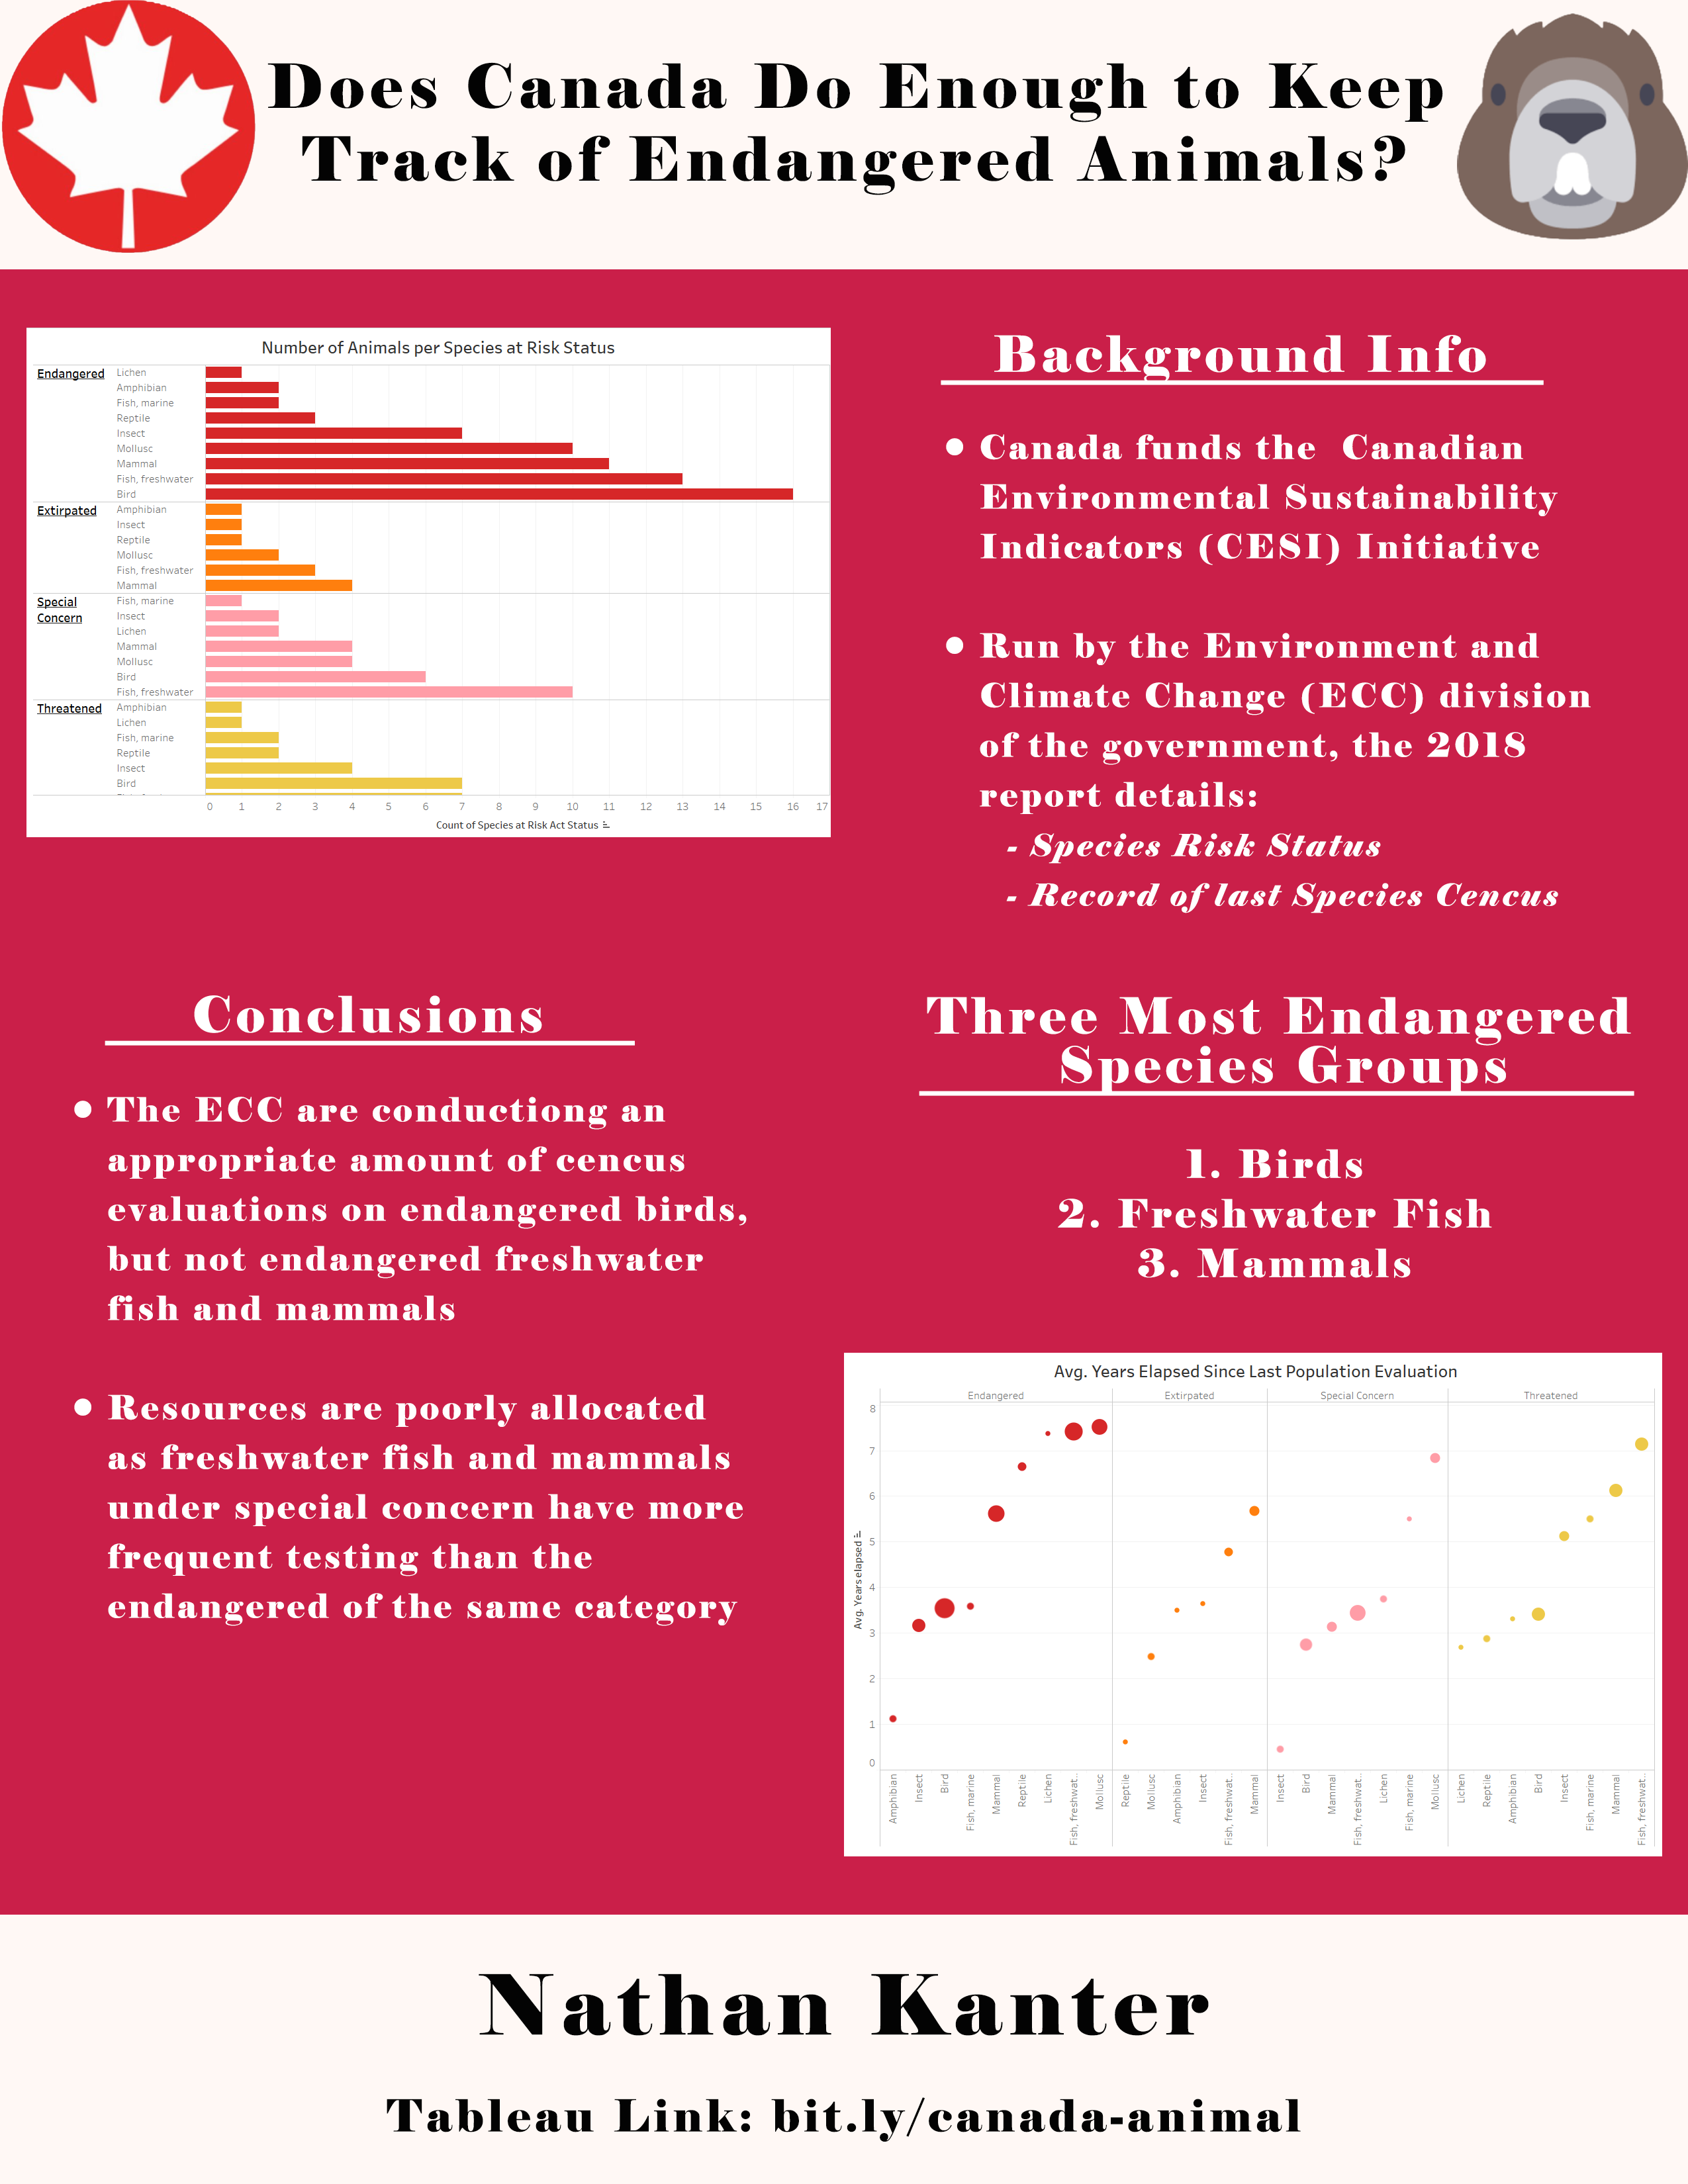
Endangered Species of Canada
Infographic, Animals

3D Rendered Kitchen
Modeling, Environment Creation
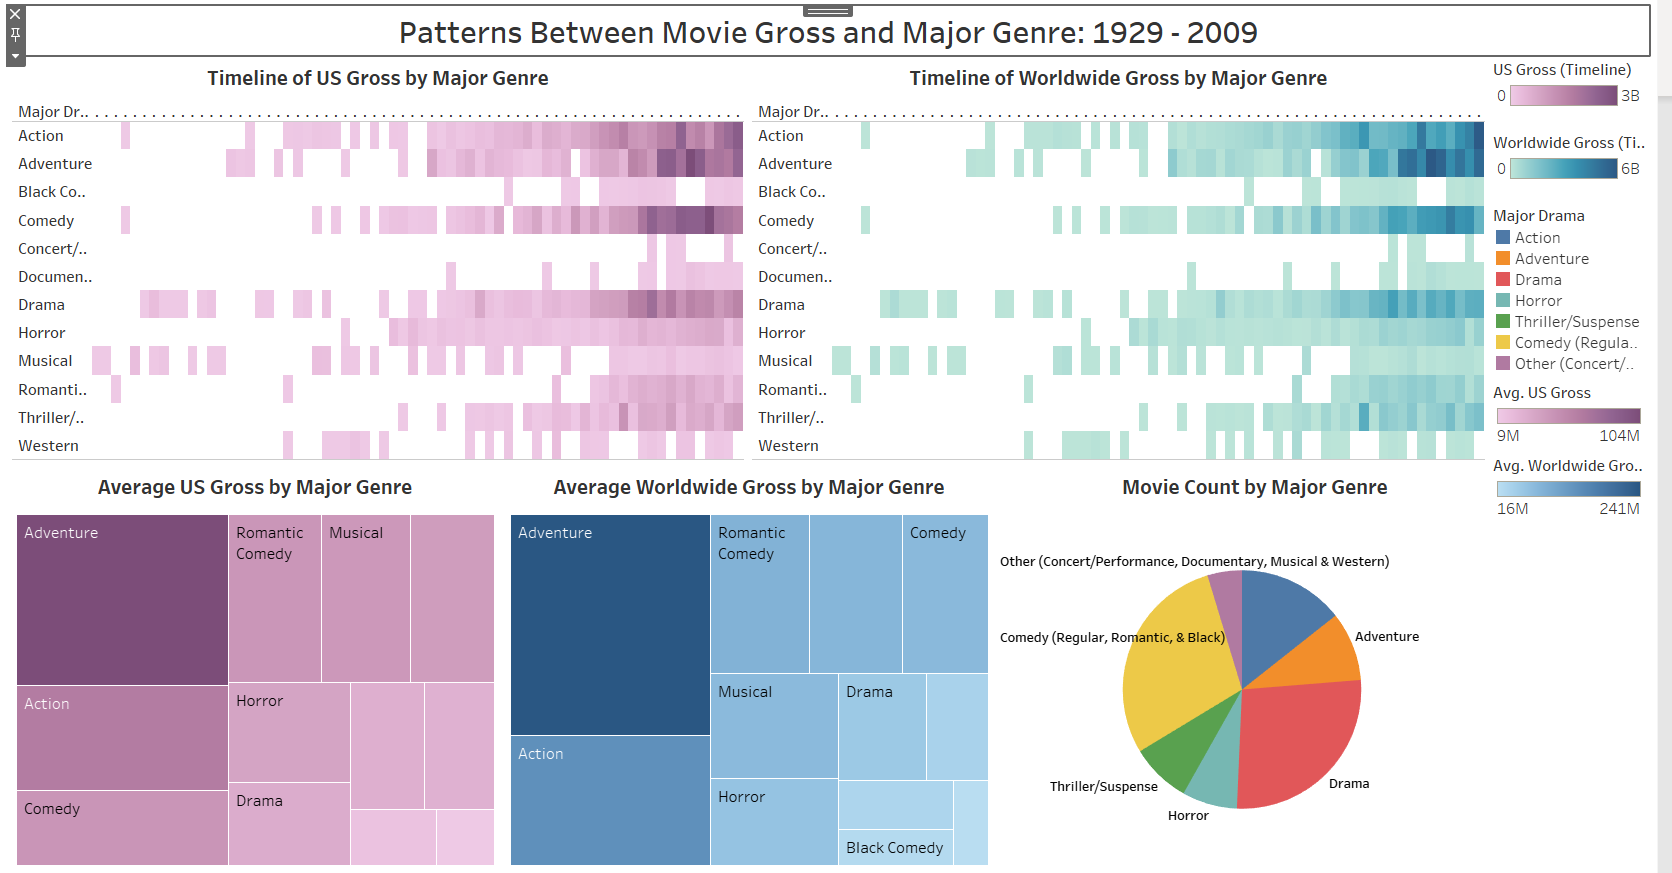
IMBD Movie Dashboards
Dashboards, Film

British Telephone Booth
Modeling, Renders
UPS Financial Dashboards
Fianancial, Dashboards
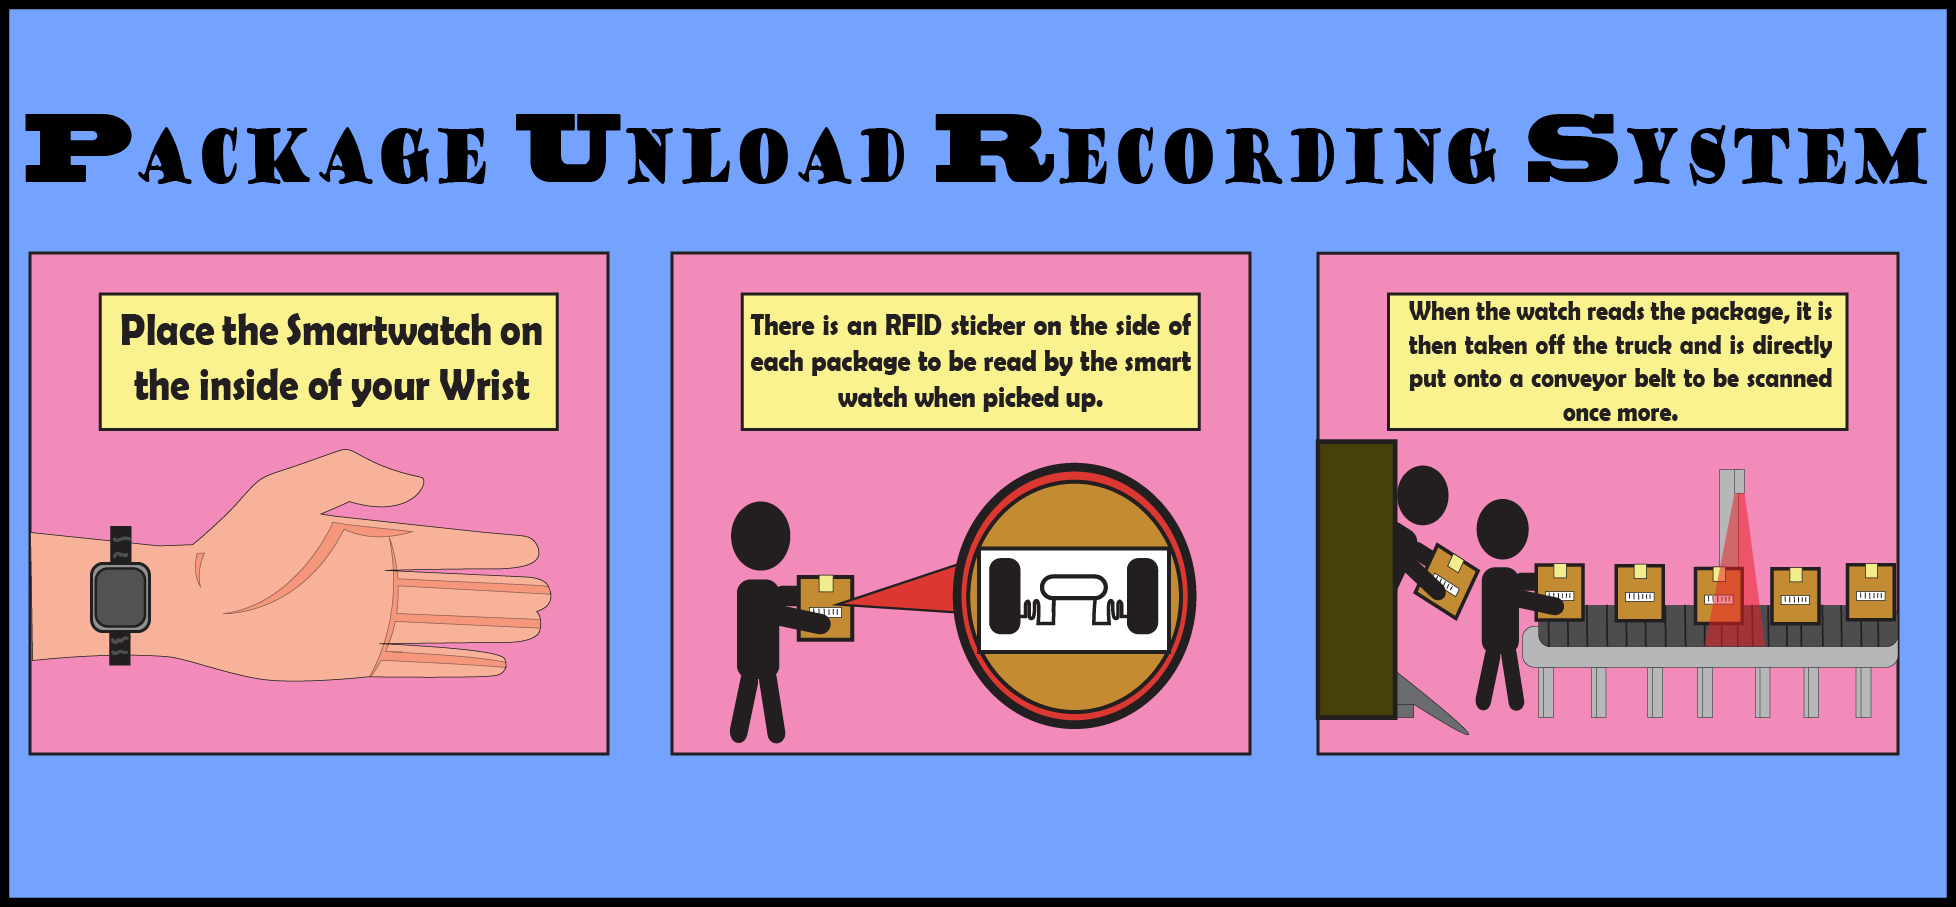
UPS Package Unload Recording System
Original Content, Infographic

Children's Bathroom & Toys
Modeling, Renders

"POT"ted Tomato Plant
Modeling, Renders

Death Character Model
Modeling, Renders
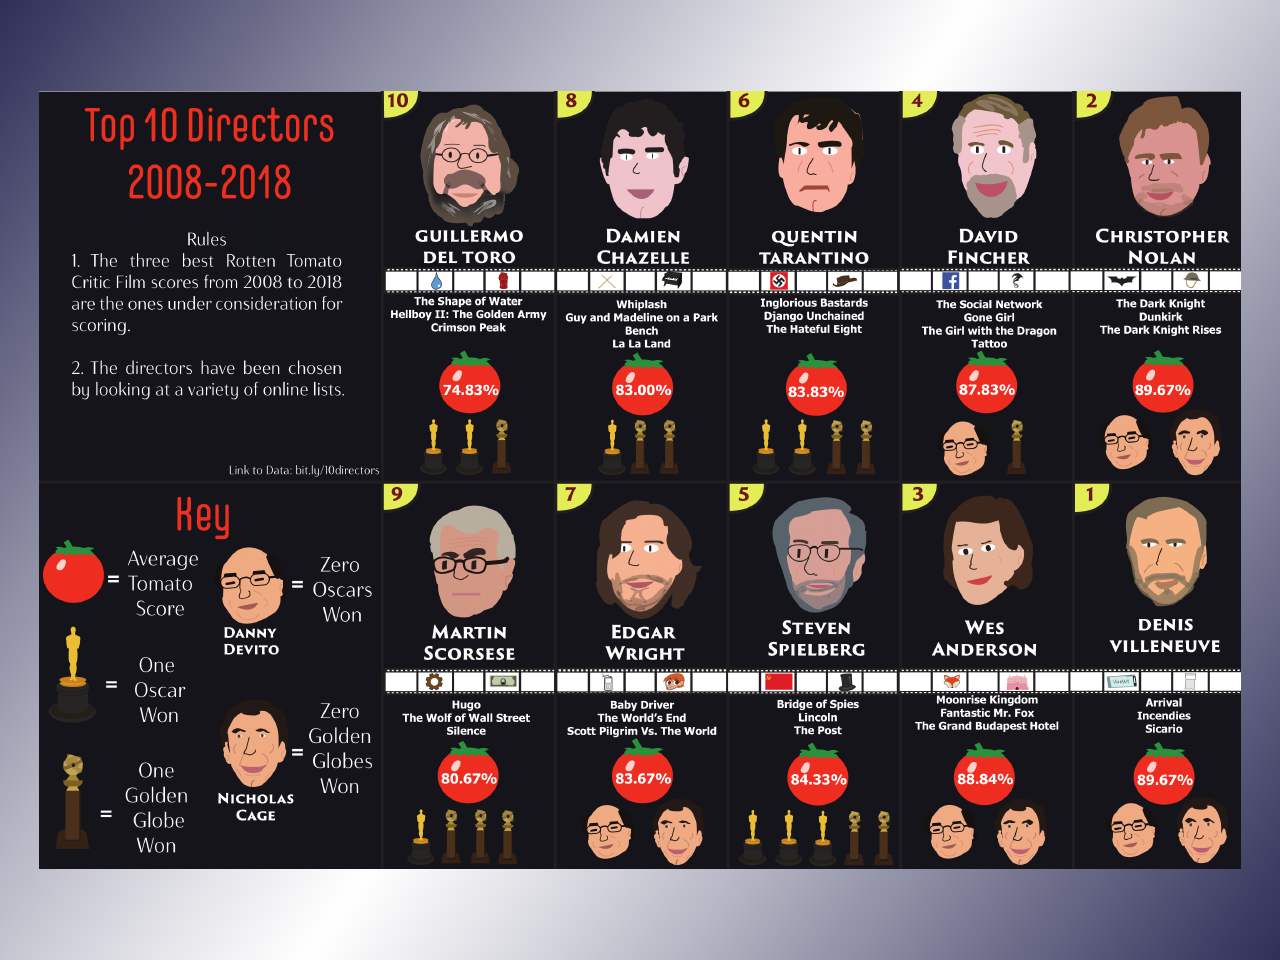
Top 10 Directors: 2008 - 2018
Original Content, Infographic